The big picture. (Business cycle)
- Against All Odds Research
- Mar 21, 2023
- 3 min read
Updated: Mar 29, 2023
Please watch all parts of this series starting with https://youtu.be/4Pf-HbxoNoI
Reflexive processes tend to follow a certain pattern. In the early stages, the trend has to be self-reinforcing, otherwise the process aborts. As the trend extends, it becomes increasingly vulnerable because the fundamentals such as trade and interest payments move against the trend, in accordance with the precepts of classical analysis, and the trend becomes increasingly dependent on the prevailing bias. Eventually, a turning point is reached and, in a full-fledged sequence, a self-reinforcing process starts operating in the opposite direction. ~ Soros


Kondratiev wave theory

Presidential

The concept of "relative value"

Total sector returns

Meb Faber's strategy.

Meb's trend following filter.
The rules
The trading rules are as follows:
The buy signal: Buy the top three sectors with the biggest gains over a three-month timeframe when the S&P 500 Index is trading above its 10-month simple moving average.
The sell signal: Sell all positions anytime the S&P 500 Index falls below its 10-month simple moving average at the month’s close.
Rebalancing criteria: Rebalance the portfolio once per month by selling sectors that fall out of the top three and buying the sectors that move into the top three.

The last 3 months (sectors)

The last 3 months (Asset allocation)

Currency

International ETF's

YTD now let's combine a couple things.

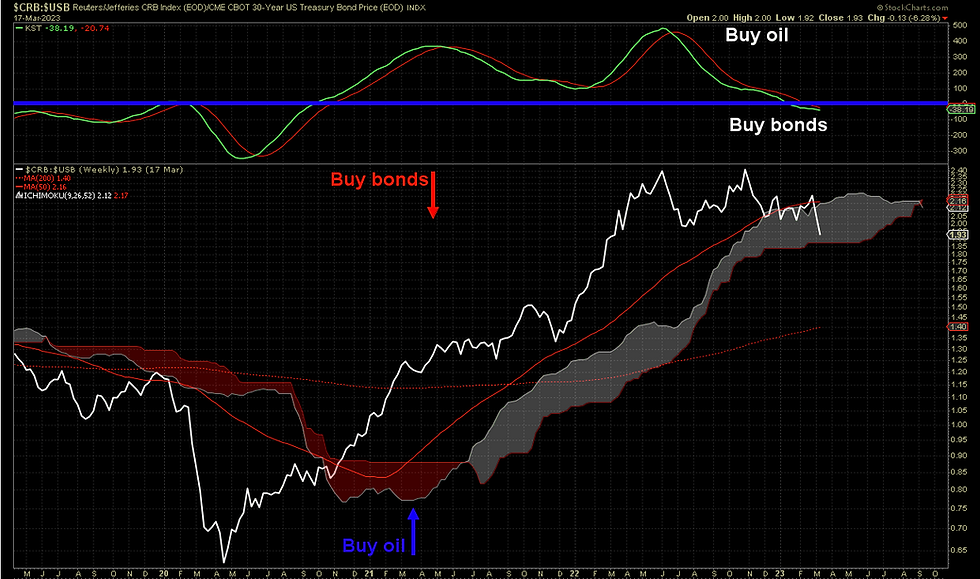
CRB:USB ratio

GLD:DBC ratio

Putting a few things together (macro fundamentals, technicals and sentiment) can give you a very powerful window in to market direction.
"We aren’t as much interested in what a company is going to earn next quarter, or what 1975 aluminium shipments are going to be, as we are in how broad social, economic, and political factors will alter the destiny of an industry or stock group for some time to come. If there is a wide difference between what we see and the market price of a stock, all the better, because then we can make money.We aren’t as much interested in what a company is going to earn next quarter, or what 1975 aluminium shipments are going to be, as we are in how broad social, economic, and political factors will alter the destiny of an industry or stock group for some time to come. If there is a wide difference between what we see and the market price of a stock, all the better, because then we can make money."

“Economic history is a never-ending series of episodes based on falsehoods and lies, not truths. It represents the path to big money. The object is to recognize the trend whose premise is false, ride that trend and step off before it is discredited.”


The zero line represents full economic capacity, or a closed GDP gap. When the reading is positive (above the zero line), it means the economy is producing at above trend capacity. This causes inflation to rise and drives the central bank to hike rates. This is why a recession (marked by the vertical grey bands) follows after each subsequent period of above capacity production. (Macro ops)
Let's put it together.


Banks:Nasdaq ratio

The dollar is incredibly important to emerging markets (thank you captain obvious)

Banks:Gold ratio

Yield curve
“Everything can be taken from a man but one thing: the last of the human freedoms—to choose one's attitude in any given set of circumstances, to choose one's own way.” “When we are no longer able to change a situation, we are challenged to change ourselves.” Victor Frankl

Copper:Gold ratio

Semis:Dow ratio

NDX:SML ratio

DAX

Look outside of the US

How to play it from the long side (Some have been bought, some are waiting for new signals, this is a road map)

Cash market sectors and weighting.

Warning signs.

Comments